Making a Digital Power Meter - Part 1: Meter

I recently read a lot about smart power meters and how they allow detailed analysis of a households power consumption as well as the habits of its inhabitants. Since our power meter is an old analog Ferraris Meter, I decided to build one myself, which would allow me to analyse our energy consumption without giving the info to my energy provider. This makes it even better than a commercial one!
At first, I wanted to measure the power consumption using a microcontroller and a current clamp sensor. Current clamp sensors use the magnetic field generated by the current flowing through an electrical conductor to measure the current. However, since I am not a certified electrician, there are certain drawbacks associated when tinkering with the electrical installation in your house (the insurance might complain in case of a fire). Then, I stumbled upon this german article by Martin Kompf which described how you can read an old ferraris meter like the one in our house, using only an infrared LED and an infrared photoresistor.
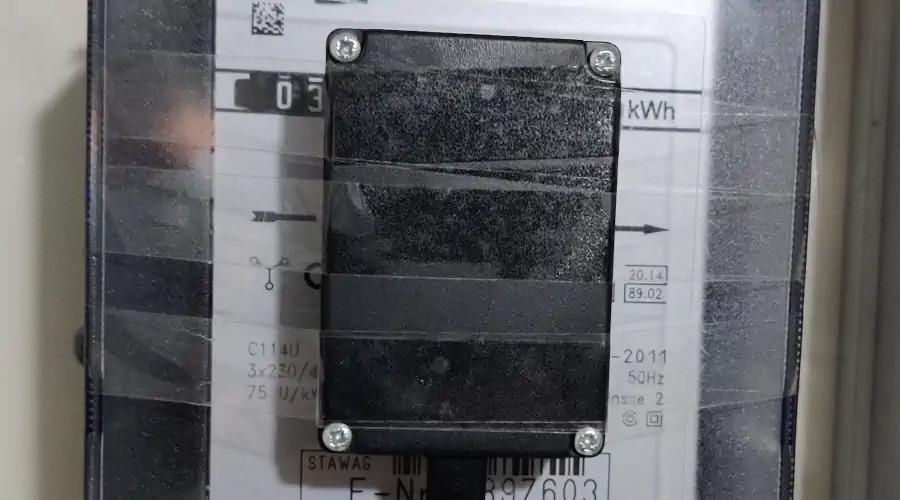
It works like this: The ferraris meter has a small metal wheel with a red stripe on it that spins when power is consumed. Furthermore, it spins exactly 75 times per kWh consumed. This means that we can just count the rotations of this disc, multiply them by 13.3, and get a relatively accurate measurement of how much power we consumed. The drawback of this method is that it is not as exact as other methods, but the resolution will hopefully be good enough to get a good idea how much energy we are using and when. So I hooked up an infrared LED and an infrared photoresistor to an ESP8266 that I had lying around, put it in a box, attached it to the looking glass of the ferraris meter, and started coding. Below is a (badly drawn) schematic of the ESP:

Here’s the basic idea: The LED emits infrared light, which is reflected onto the photoresistor by the metal disc. When the red stripe reaches the LED, the amount of reflected light changes, changing the resistance of the photoresistor. We measure this change using the analog input of the ESP8266, and register it with a timestamp. We can then calculate how much energy was consumed by multiplying the number of disc-spins with 13.3. It took a little bit of experimenting to determine the correct threshold for detecting the red stripe.
As with most of my posts, please check GitHub for the complete code, I might skip parts and pieces that are not interesting to explain in detail!
Let us have a look at the code for the ESP8266. I like to initialize all the variables first. Then we connect to the WiFi network in the setup method:
#include <ESP8266WiFi.h>

#define IRLED 4

int withLed = 0;
int withoutLed = 0;
int stripeCount = 0;
int diff = 0;
bool disconn = false;
unsigned long disconnTime = 0;
unsigned long duration = 0;
unsigned long lastTick = 0;
int ticksMissed = 0;
WiFiClient client;

const int threshold = 150;

// Wi-Fi Settings
const char* ssid = "WIFI_SSID"; // your wireless network name (SSID)
const char* password = "SUPERSECRETPASSWORD"; // your Wi-Fi network password
const char* apiIP = "192.168.0.38";

void setup() {
  Serial.begin(115200);
  WiFi.begin(ssid, password);
  WiFi.mode(WIFI_STA);
  Serial.print("Connecting to WiFi");
  pinMode(IRLED, OUTPUT);

  while (WiFi.status() != WL_CONNECTED) {
    delay(500);
    Serial.print(".");
  }
  Serial.println("Connected to WiFi!");
}
Since we plan on letting this run permanently, we need to consider connection losses. Someone might switch of the router, or the reception might just be bad, etc. I added an API method to report connection losses on reconnect, so that I could see if the connection was bad. My meter is located inside an aluminium box in my basement, so I thought it might be necessary to add a WiFi antenna on the outside of this box. However, the connection is pretty stable so far:
void loop() {

  if (WiFi.status() != WL_CONNECTED && !disconn) {
      disconn = true;
      disconnTime = millis();
      Serial.println("Lost WiFi connection!");
    };

  if (WiFi.status() == WL_CONNECTED && disconn) {
      disconn = false;
      duration = millis() - disconnTime;

      //Report the disconnect to the API
      if (client.connect(apiIP, 80)){
        // we are connected to the host!
        client.print(String("GET /connloss/")+ disconnTime + "/" + ticksMissed + " HTTP/1.1\r\n" +
             "Host: " + apiIP + "\r\n" +
             "Connection: close\r\n" +
             "\r\n"
            );
        Serial.println("Reporting disconnect!");
        while (client.connected()){
          if (client.available()){
            String line = client.readStringUntil('\n');
            Serial.println(line);
          }
        }
        client.stop();
        Serial.println("\n[Disconnected]");
        ticksMissed = 0;
      }else{
        // connection failure
        Serial.println("Connection to API failed!");
      }

    }
Next, we will have a look at the most interesting part: The stripe detection. Since we only want to record one tick per rotation (instead of continously ticking while over a stripe) we only send a tick to the API when we detect that the stripe has ended. There are a few additional things I had to do to ensure proper readings:
- We need to have an extra state while we are detecting the red stripe, so that we don’t register multiple turns when the wheel is spinning slowly.
- Since there may be environment light that also changes the photoresistor’s resistance, we take alternating measurements: Once with the LED switched on, and once with the LED switched off. By calculating the difference between these two measurements, we only get the light that is emitted by the LED.
- The metal disc in my meter had a little scratch somewhere on the red stripe, which, when the wheel spins really slowly, causes the one red stripe to look like two red stripes. I added a check whether the last red stripe was detected more than a second ago, as anything faster would correspond to a power usage of more than 48kW, which is unrealistic in our household.
In the end, this is what the stripe detection code looks like:
  //Read without LED first, then switch the LED on and read again. This will filter out IR light that is not generated by the LED.
  withoutLed = analogRead(A0);

  digitalWrite(IRLED, LOW);

  delay(10);

  withLed = analogRead(A0);

  digitalWrite(IRLED, HIGH);

  diff = withoutLed - withLed;

//    Serial.print("Without LED: ");
//    Serial.println(withoutLed);

//    Serial.print("With LED: ");
//    Serial.println(withLed);

//    Serial.print("Difference is: ");
//    Serial.println(diff);

  //We are detecting a stripe! (Reality check: last tick was at least 1 sec ago -> less than 50kW usage)
  if(diff < threshold && millis() - lastTick > 1000){
    stripeCount++;
  }

  //We were detecting a stripe and it has just ended!
  if(diff > threshold && stripeCount > 0){
    stripeCount = 0;

    //Report the stripe to the API
    if (client.connect(apiIP, 80)){
      // we are connected to the host!
      client.print(String("GET /tick") + " HTTP/1.1\r\n" +
           "Host: " + apiIP + "\r\n" +
           "Connection: close\r\n" +
           "\r\n"
          );
      Serial.println("Reporting tick!");
      while (client.connected()){
        if (client.available()){
          String line = client.readStringUntil('\n');
          Serial.println(line);
        }
      }
      client.stop();
      Serial.println("\n[Disconnected]");
      lastTick = millis();
    }else{
      // connection failure
      Serial.println("Connection to tick-API failed!");
      ticksMissed++;
    }
  }

  //The led probably needs some time to switch on and off
  delay(20);
}
As you can see, I set up a little API to which the disc-spins (ticks) and connection losses are reported. The API is also available in the git repository, and I am running it on a raspberry pi. I will write a second part in the near future about that API. So far, I have collected about two months of data, and I will soon try to throw some of my very minimal but freshly acquired data science skills at it, which I will hopefully describe in a third part!